Node wiki
Every node explained — what it does, its inputs and outputs, and when to reach for it.
ReferenceChannel reference
Every telemetry channel, grouped — names, types and meaning.
 Graph Editor · Quick start
// Quick start · ~10 min
Build a sim-racing dashboard by wiring a widget to live telemetry — no racing sim required. By the end you'll have a bar that fills as RPM rises, built and driven by data.
What you'll build: a horizontal bar whose fill follows the rpm channel, scaled against a max of 5000.
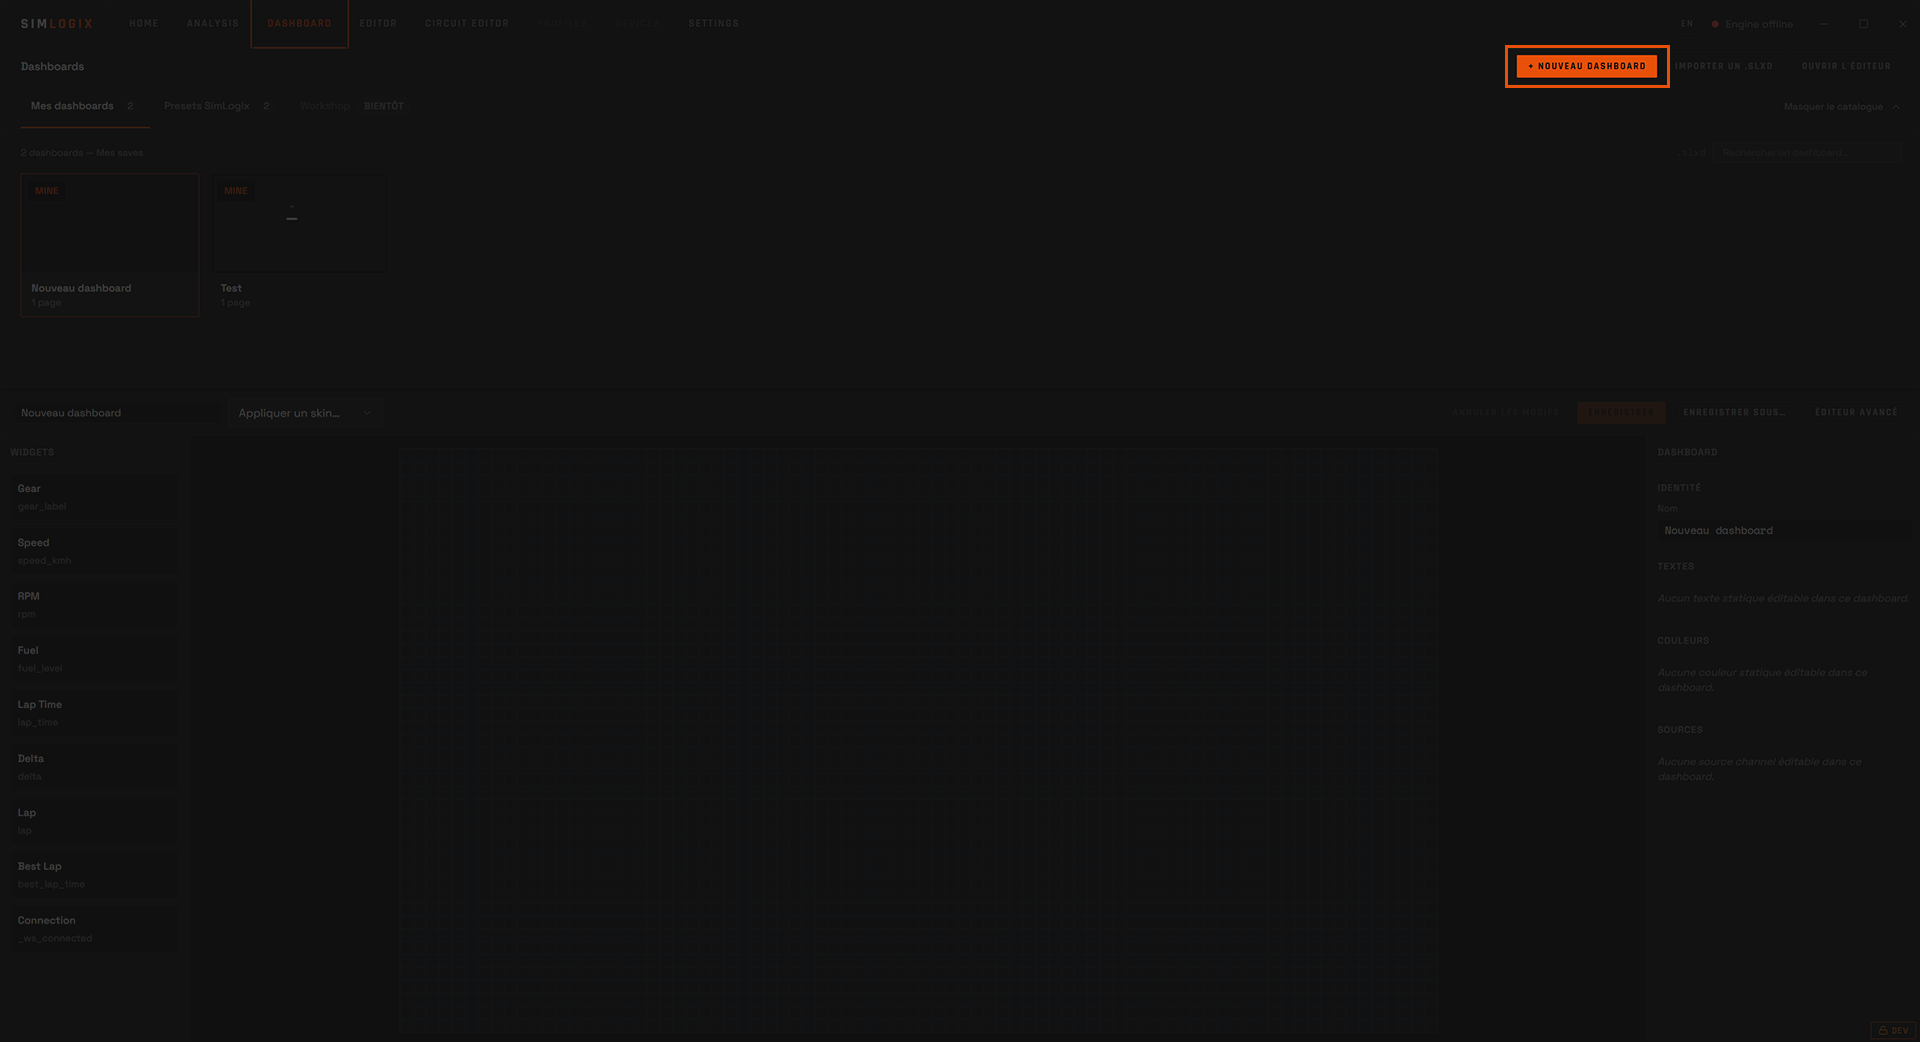
In the app's top bar, open the Editor page.
Click the + button in the tab bar. The New dashboard dialog asks for a resolution — pick a preset (e.g. 1920×1080) or enter a custom size; it's locked once created. Confirm and an Untitled dashboard tab opens, ready to edit. You'll name it when you save (step 06).
Spot the areas you'll use. The centre stacks the canvas (visual preview) over the node graph (wiring); tools sit on the left, properties on the right, and the mock telemetry sliders dock by the canvas.
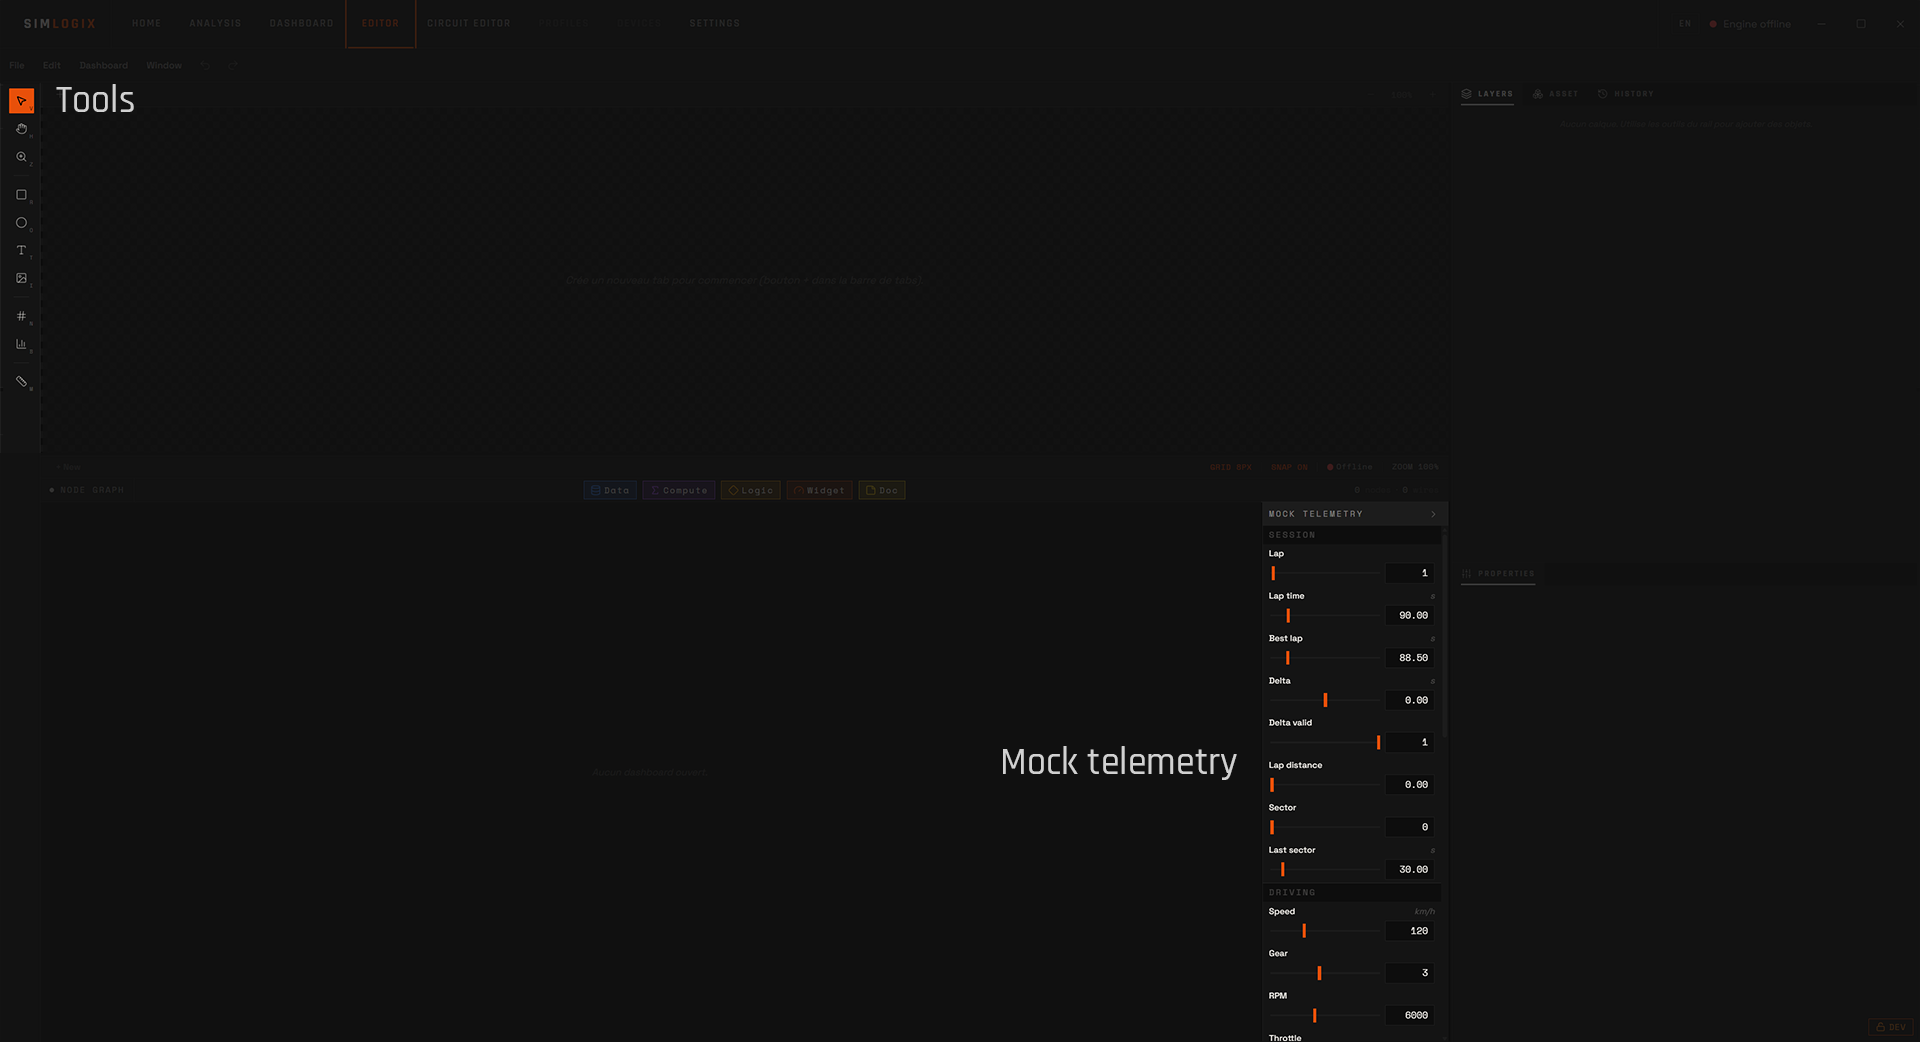
| Area | Where | For |
|---|---|---|
| Tool rail | far left | Select, shapes, and the widget tools you'll use next. |
| Canvas | centre, upper | The visual dashboard — place and arrange widgets. |
| Node graph | centre, lower | The wiring behind the visuals. |
| Properties | right | Edit the selected widget's look and data. |
| Mock telemetry | by the canvas | Sliders that fake live data so you can test without a sim. |
| Status bar | middle strip | Grid/snap, the telemetry indicator, and zoom. |
In the node graph's toolbar (below the canvas), click the Assets chip and choose Bar. The Bar is a ready-made asset built from rectangles.
The bar drops onto the canvas at its default size — empty for now, because nothing feeds it yet. It also shows up as a Bar asset node in the graph below.
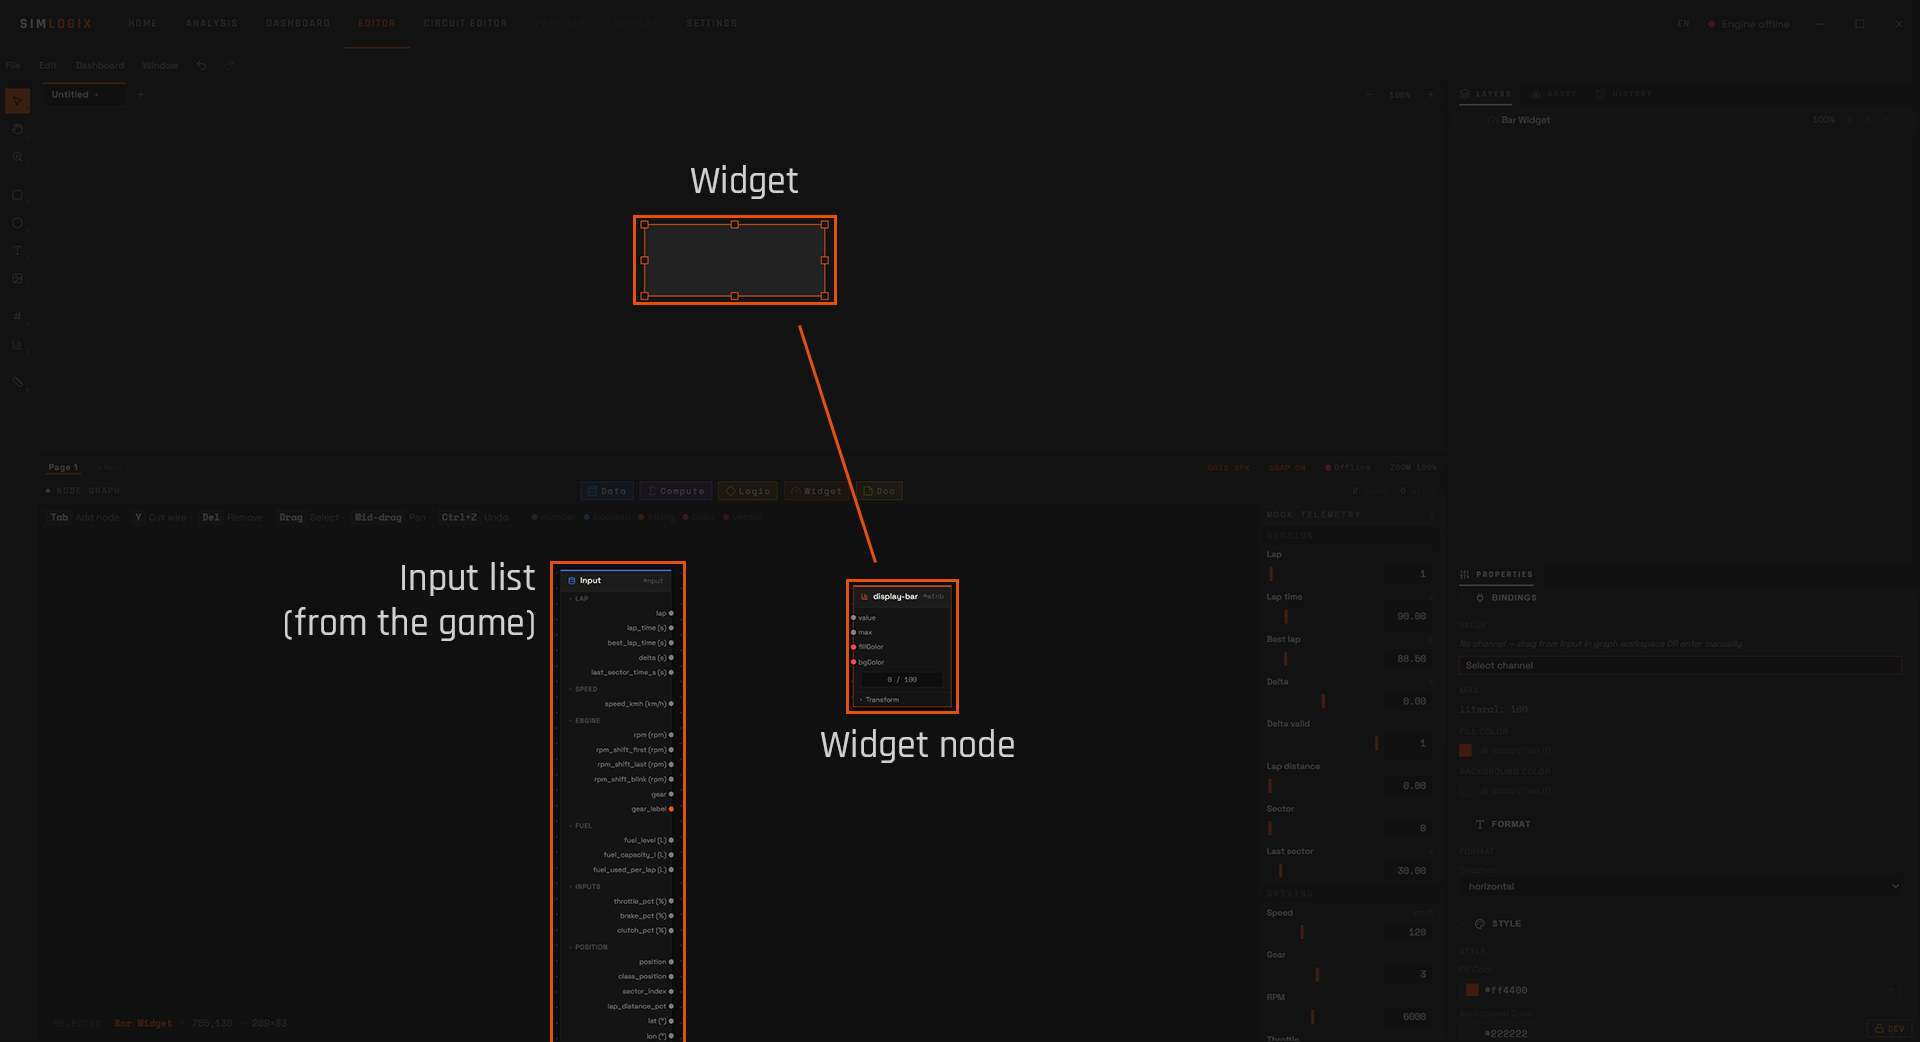
This is the heart of the editor: data flows left → right along wires. The graph already holds an Input node — every channel the game sends — and your new Bar asset. You'll connect them.
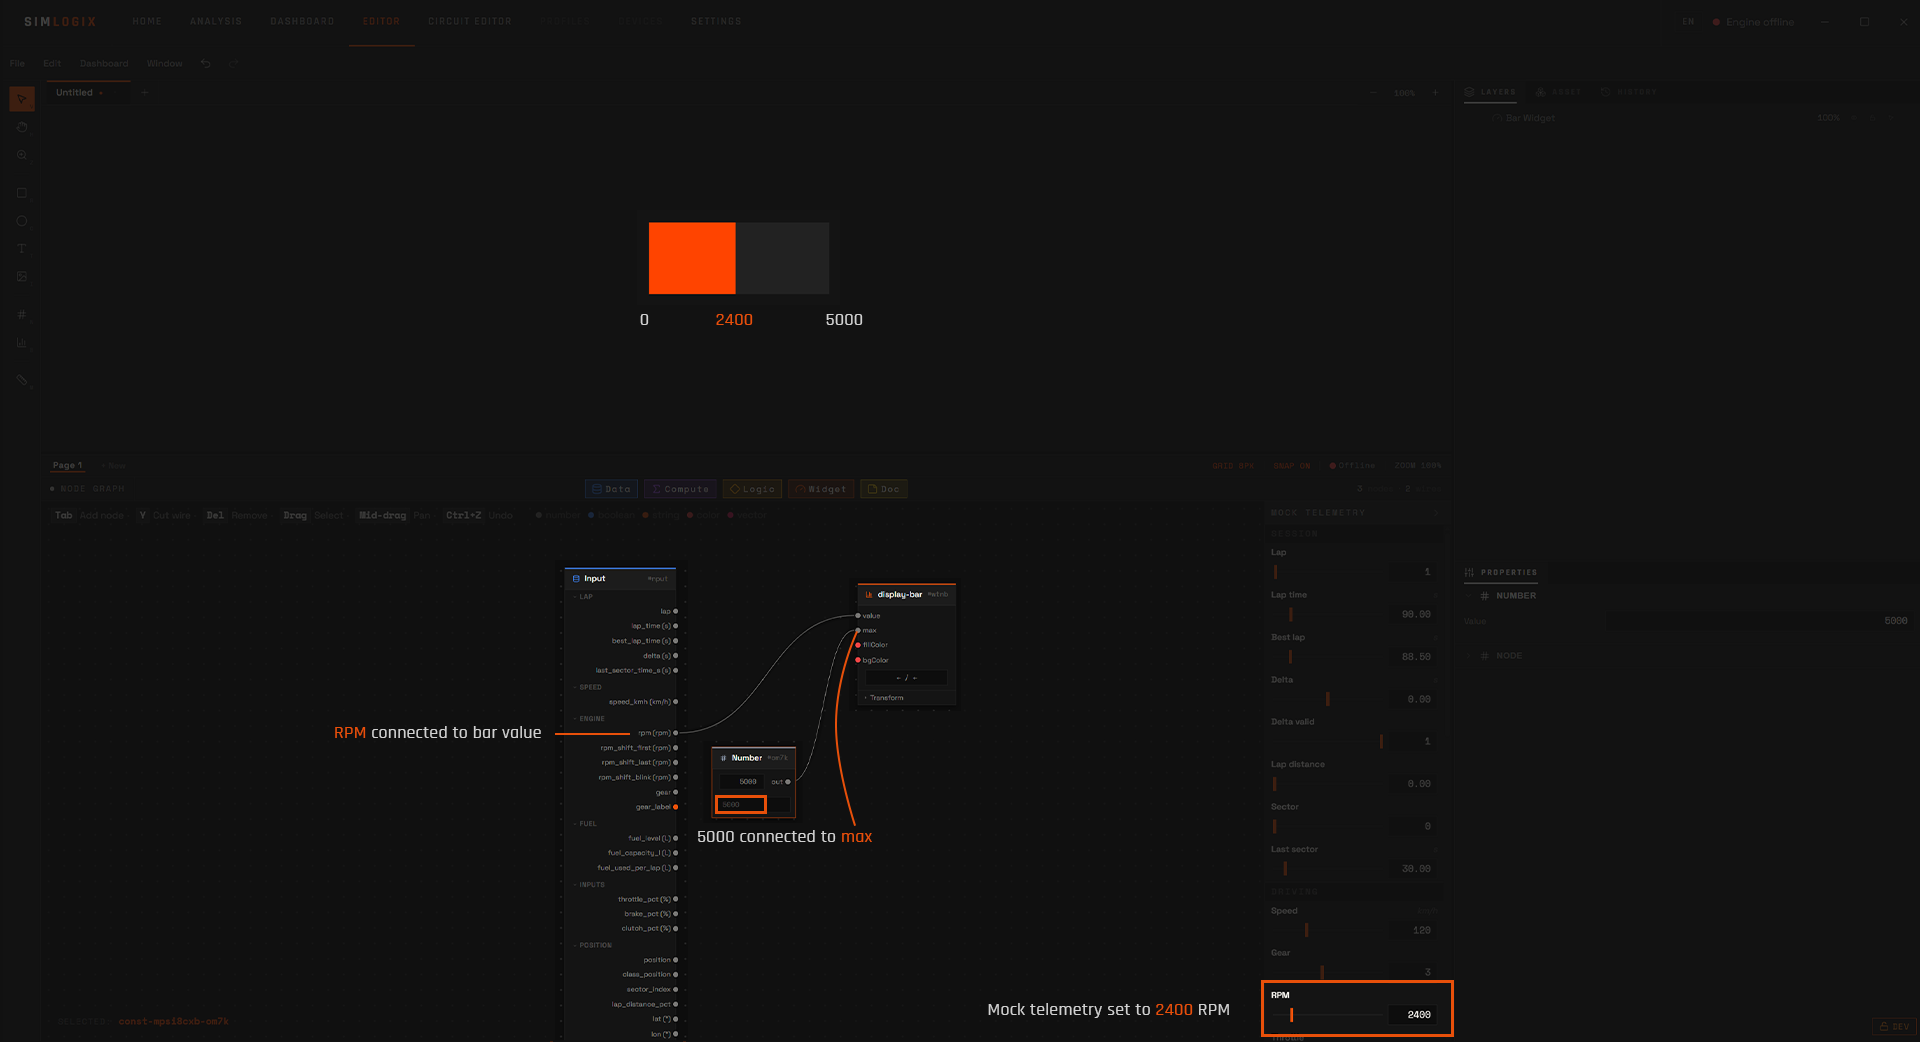
In the graph, drag a wire from the Input node's rpm output to the Bar's value input. That single connection is the binding.
Press Tab, add a Number node, set it to 5000, and wire it to the bar's max. Now the fill is RPM scaled from 0 to 5000.
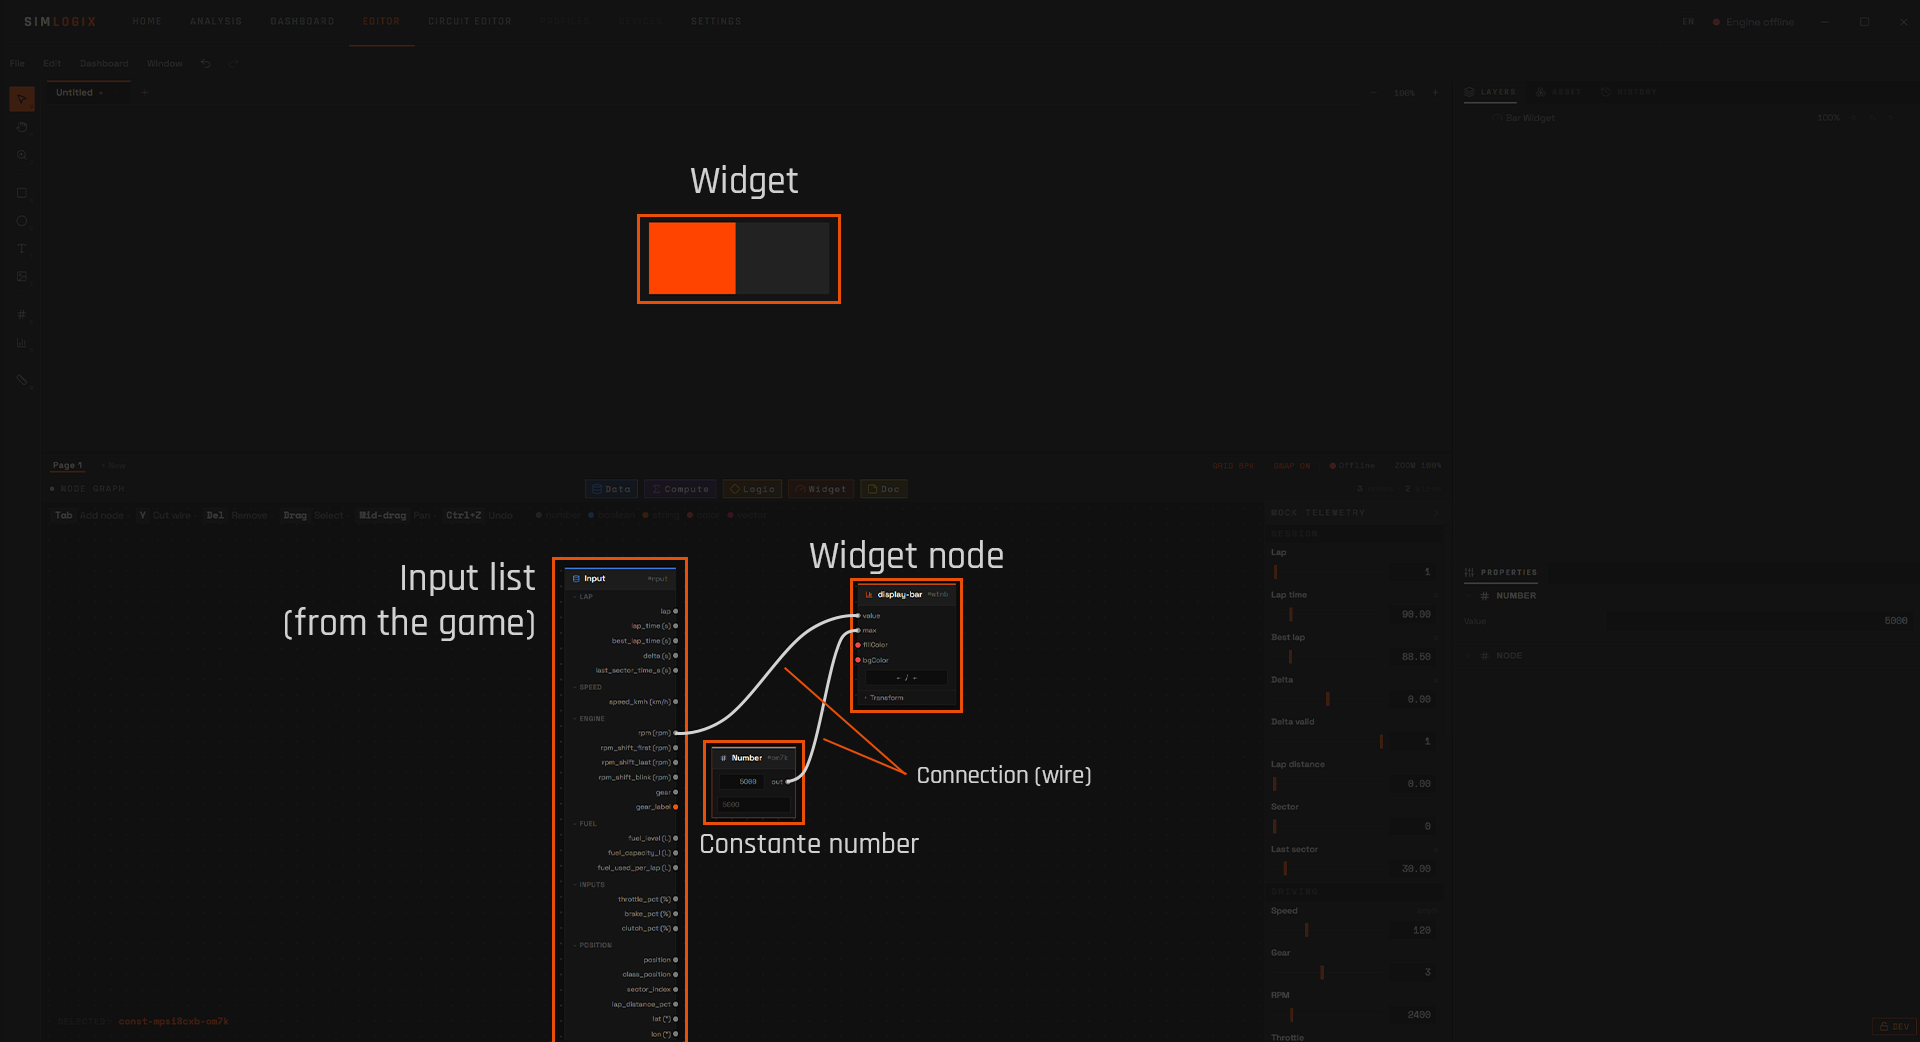
max. ┌─────────┐ ┌──────────────┐
│ Input │──── rpm ────────────────▶│ Bar · value │
└─────────┘ ┌───▶│ Bar · max │
┌─────────┐ │ └──────────────┘
│ Number │──── 5000 ───────────┘
└─────────┘Open the mock telemetry panel and drag the RPM slider. Set it to ~2400 and the bar fills to 2400 of 5000 — a live, data-driven widget. 🎉
Press Ctrl+S. The first save opens a file dialog — pick a name and location for your .slxd file. A toast confirms (“Saved as …”), and from then on Ctrl+S saves in place. Your dashboard reopens exactly as you left it.
gear or speed for a readout.